Note
Go to the end to download the full example code.
Run module#
In this example we demonstrate how to use AequilibraE’s run module using Sioux Falls example.
References
See also
Several functions, methods, classes and modules are used in this example:
# Imports
from uuid import uuid4
from tempfile import gettempdir
from os.path import join

from aequilibrae.parameters import Parameters
from aequilibrae.utils.create_example import create_example
# Let's create the Sioux Falls example in an arbitrary folder.
folder = join(gettempdir(), uuid4().hex)

project = create_example(folder)
First, let’s check the matrix information using matrix_summary(). This method
provides us useful information such as the matrix total, minimum and maximum values
in the array, and the number of non-empty pairs in the matrix.
Notice that the matrix summary is presented for each matrix core.
project.run.matrix_summary()
{'demand_omx': {'matrix': {'total': np.float64(360600.0), 'min': np.float64(0.0), 'max': np.float64(4400.0), 'nnz': np.int64(528)}}, 'demand_mc': {'car': {'total': np.float64(271266.6324170904), 'min': np.float64(0.0), 'max': np.float64(3414.160702028352), 'nnz': np.int64(528)}, 'motorcycle': {'total': np.float64(89819.0708124364), 'min': np.float64(0.0), 'max': np.float64(1237.9652821904103), 'nnz': np.int64(528)}, 'trucks': {'total': np.float64(90235.57459796841), 'min': np.float64(0.0), 'max': np.float64(1318.3068496025667), 'nnz': np.int64(528)}}, 'skims': {'distance_blended': {'total': np.float64(6725.294972629576), 'min': np.float64(0.0), 'max': np.float64(27.000048290421308), 'nnz': np.int64(552)}, 'time_final': {'total': np.float64(13600.90095750823), 'min': np.float64(0.0), 'max': np.float64(46.66452630996126), 'nnz': np.int64(552)}}, 'demand_aem': {'matrix': {'total': np.float64(360600.0), 'min': np.float64(0.0), 'max': np.float64(4400.0), 'nnz': np.int64(528)}}}
If our matrices folder is empty, instead of a nested dictionary of data, AequilibraE run would return an empty dictionary.
Let’s create a graph for mode car.
mode = "c"
network = project.network
network.build_graphs(modes=[mode])
graph = network.graphs[mode]
graph.set_graph("distance")
graph.set_skimming("distance")
graph.set_blocked_centroid_flows(False)
With the method graph_summary(), we can check the total number of links, nodes, and zones,
as well as the compact number of links and nodes used for computation. If we had more than
one graph, its information would be displayed within the nested dictionary.
project.run.graph_summary()
{'c': {'num_links': 76, 'num_nodes': 24, 'num_zones': 24, 'compact_num_links': 76, 'compact_num_nodes': 24}}
If no graphs have been built, an empty dictionary will be returned.
Let’s add a create_delaunay function to our run/__init__.py file.
This function replicates the example in which we create Delaunay lines.
func_string = """
def create_delaunay(source: str, name: str, computational_view: str, result_name: str, overwrite: bool=False):\n
\tfrom aequilibrae.utils.create_delaunay_network import DelaunayAnalysis\n
\tproject = get_active_project()\n
\tmatrix = project.matrices\n
\tmat = matrix.get_matrix(name)\n
\tmat.computational_view(computational_view)\n
\tda = DelaunayAnalysis(project)\n
\tda.create_network(source, overwrite)\n
\tda.assign_matrix(mat, result_name)\n
"""
with open(join(folder, "run", "__init__.py"), "a") as file:
    file.write("\n")
    file.write(func_string)
Now we add new parameters to our model
p = Parameters()
p.parameters["run"]["create_delaunay"] = {}
p.parameters["run"]["create_delaunay"]["source"] = "zones"
p.parameters["run"]["create_delaunay"]["name"] = "demand_omx"
p.parameters["run"]["create_delaunay"]["computational_view"] = "matrix"
p.parameters["run"]["create_delaunay"]["result_name"] = "my_run_module_example"
p.write_back()
And we run the function
project.run.create_delaunay()
delaunay                                          :   0%|          | 0/24 [00:00<?, ?it/s]
Equilibrium Assignment                            :   0%|          | 0/250 [00:00<?, ?it/s]
All-or-Nothing - Traffic Class: delaunay          :   0%|          | 1/250 [00:00<00:00, 48210.39it/s]
All-or-Nothing - Traffic Class: delaunay          :   0%|          | 1/250 [00:00<00:00, 11618.57it/s]
All-or-Nothing - Traffic Class: delaunay          :   0%|          | 0/250 [00:00<?, ?it/s]
All-or-Nothing - Traffic Class: delaunay - Zones: 0/24:   0%|          | 0/250 [00:00<?, ?it/s]
All-or-Nothing - Traffic Class: delaunay - Zones: 10/24:   0%|          | 0/250 [00:00<?, ?it/s]
All-or-Nothing - Traffic Class: delaunay - Zones: 20/24:   0%|          | 0/250 [00:00<?, ?it/s]
All-or-Nothing - Traffic Class: delaunay - Zones: 24/24:   0%|          | 0/250 [00:00<?, ?it/s]
Note
To run the create_delaunay function we created above without argument
values, we must insert the values as a project parameter. Adding an unused
parameter to the parameters.yml file will raise an execution error.
Creating Delaunay lines also creates a results_database.sqlite that contains the
result of the all-or-nothing algorithm that generated the output. We can check
the existing results in the results_database using the results_summary method.
project.run.results_summary()
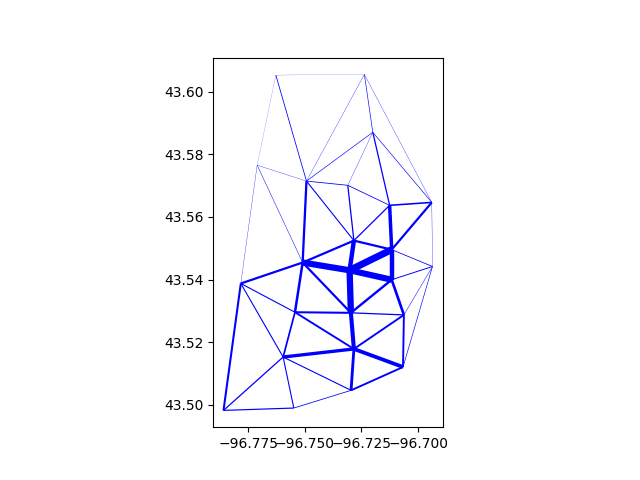
Let’s check what our Delaunay lines look like!
import geopandas as gpd
Let’s retrieve the results
results = project.results.get_results("my_run_module_example").set_index("link_id")
with project.db_connection_spatial as conn:
    links = gpd.read_postgis(
        "SELECT link_id, st_asBinary(geometry) geometry FROM delaunay_network", conn, geom_col="geometry", crs=4326
    )
links.set_index("link_id", inplace=True)
df = links.join(results)
max_vol = df.matrix_tot.max()
And finally plot the data
df.plot(linewidth=5 * df["matrix_tot"] / max_vol, color="blue")
<Axes: >
project.close()
Pipeline image credits to Data-pipeline icons created by Vectors Tank - Flaticon
Total running time of the script: (0 minutes 0.708 seconds)