Note
Go to the end to download the full example code
7.6. Project from Open-Street Maps
On this example we show how to create an empty project and populate with a network from Open-Street maps
But this time we will use Folium to visualize the network
# Imports
from uuid import uuid4
from tempfile import gettempdir
from os.path import join
from aequilibrae import Project
import folium
We create an empty project on an arbitrary folder
fldr = join(gettempdir(), uuid4().hex)
project = Project()
project.new(fldr)
Now we can download the network from any place in the world (as long as you have memory for all the download and data wrangling that will be done)
# We can create from a bounding box
# or from a named place. For the sake of this example, we will choose the small nation of Nauru
project.network.create_from_osm(place_name="Nauru")
We grab all the links data as a Pandas dataframe so we can process it easier
links = project.network.links.data

# We create a Folium layer
network_links = folium.FeatureGroup("links")

# We do some Python magic to transform this dataset into the format required by Folium
# We are only getting link_id and link_type into the map, but we could get other pieces of info as well
for i, row in links.iterrows():
    points = row.geometry.wkt.replace("LINESTRING ", "").replace("(", "").replace(")", "").split(", ")
    points = "[[" + "],[".join([p.replace(" ", ", ") for p in points]) + "]]"
    # we need to take from x/y to lat/long
    points = [[x[1], x[0]] for x in eval(points)]

    line = folium.vector_layers.PolyLine(
        points, popup=f"<b>link_id: {row.link_id}</b>", tooltip=f"{row.link_type}", color="blue", weight=10
    ).add_to(network_links)
We get the center of the region we are working with some SQL magic
curr = project.conn.cursor()
curr.execute("select avg(xmin), avg(ymin) from idx_links_geometry")
long, lat = curr.fetchone()
map_osm = folium.Map(location=[lat, long], zoom_start=14)
network_links.add_to(map_osm)
folium.LayerControl().add_to(map_osm)
map_osm
project.close()
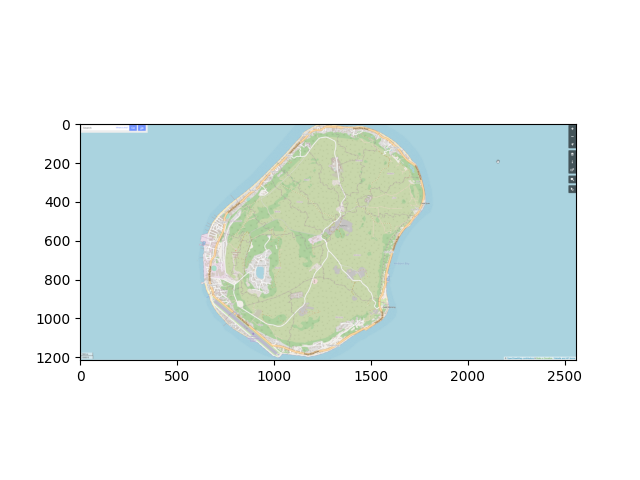
Don’t know Nauru? Here is a map
from PIL import Image
import matplotlib.pyplot as plt

img = Image.open("nauru.png")
plt.imshow(img)
<matplotlib.image.AxesImage object at 0x7f0c62d6c580>
Total running time of the script: ( 0 minutes 20.570 seconds)