Editing network geometry: Splitting link#
In this example, we split a link right in the middle, while keeping all fields in the database equal. Distance is proportionally computed automatically in the database.
Imports
[1]:
from uuid import uuid4
from tempfile import gettempdir
from os.path import join
from aequilibrae.utils.create_example import create_example
from shapely.ops import substring
import matplotlib.pyplot as plt

# We create the example project inside our temp folder
fldr = join(gettempdir(), uuid4().hex)

project = create_example(fldr)
We will split link 37 right in the middle Let’s get the link and check its length
[2]:
links = project.network.links
all_nodes = project.network.nodes

link = links.get(37)
print(link.distance)
6010.108655014215
The idea is basically to copy a link and allocate the appropriate geometries to split the geometry we use Shapely’s substring
[3]:
new_link = links.copy_link(37)

first_geometry = substring(link.geometry, 0, 0.5, normalized=True)
second_geometry = substring(link.geometry, 0.5, 1, normalized=True)

link.geometry = first_geometry
new_link.geometry = second_geometry
links.save()
The link objects in memory still don’t have their ID fields updated, so we refresh them
[4]:
links.refresh()
link = links.get(37)
new_link = links.get(new_link.link_id)
print(link.distance, new_link.distance)
3005.040184141035 3005.0684894898027
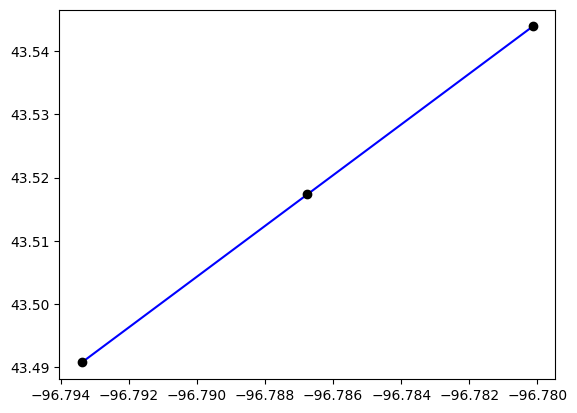
We can plot the two links only
[5]:
plt.clf()
plt.plot(*link.geometry.xy, color="blue")
plt.plot(*new_link.geometry.xy, color="blue")

for node in [link.a_node, link.b_node, new_link.b_node]:
    geo = all_nodes.get(node).geometry
    plt.plot(*geo.xy, "o", color="black")
plt.show()
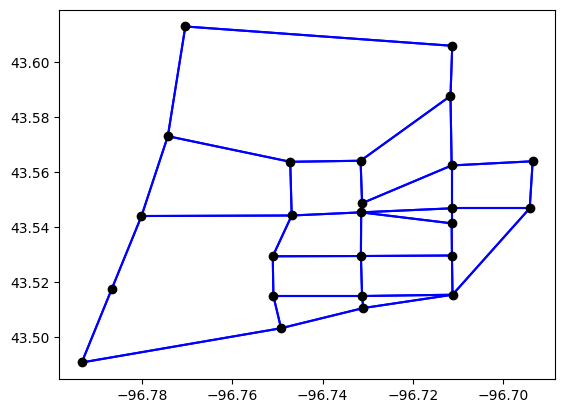
Or we plot the entire network
[6]:
plt.clf()
curr = project.conn.cursor()
curr.execute("Select link_id from links;")

for lid in curr.fetchall():
    geo = links.get(lid[0]).geometry
    plt.plot(*geo.xy, color="blue")

all_nodes = project.network.nodes
curr = project.conn.cursor()
curr.execute("Select node_id from nodes;")

for nid in curr.fetchall():
    geo = all_nodes.get(nid[0]).geometry
    plt.plot(*geo.xy, "o", color="black")

plt.show()
[7]:
project.close()