Note
Click here to download the full example code
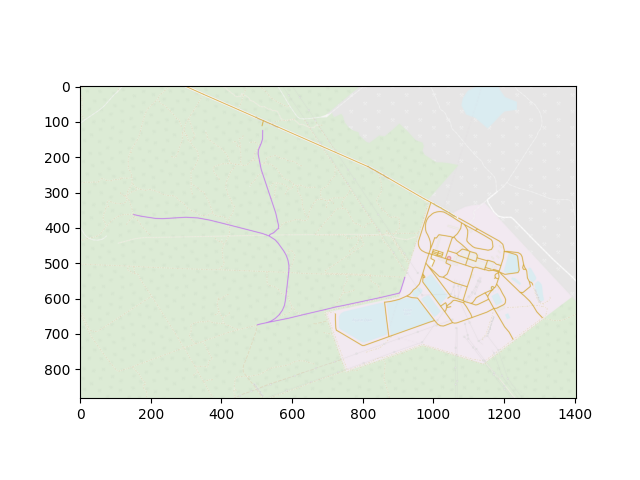
7.7. Finding disconnected links
On this example, we show how to find disconnected links in an AequilibraE network
We use the Nauru example to find disconnected links
import numpy as np
import pandas as pd
from PIL import Image
import matplotlib.pyplot as plt

img = Image.open("disconnected_network.png")
plt.imshow(img)
Out:
<matplotlib.image.AxesImage object at 0x7f0bed518a00>
# Imports
from uuid import uuid4
from tempfile import gettempdir
from os.path import join
from datetime import datetime
from aequilibrae.utils.create_example import create_example
from aequilibrae.paths.results import PathResults
We create an empty project on an arbitrary folder
fldr = join(gettempdir(), uuid4().hex)

# Let's use the Nauru example project for display
project = create_example(fldr, "nauru")

# Let's analyze the mode car, or 'c' in our model
mode = 'c'
We need to create the graph, but before that we need to have at least one centroid in our network
# We get an arbitrary node to set as centroid and allow for the construction of graphs
centroid_count = project.conn.execute('select count(*) from nodes where is_centroid=1').fetchone()[0]

if centroid_count == 0:
    arbitrary_node = project.conn.execute('select node_id from nodes limit 1').fetchone()[0]
    nodes = project.network.nodes
    nd = nodes.get(arbitrary_node)
    nd.is_centroid = 1
    nd.save()

network = project.network
network.build_graphs(modes=[mode])
graph = network.graphs[mode]
graph.set_blocked_centroid_flows(False)

if centroid_count == 0:
    # Let's revert of setting up that node as centroid in case we had to do it

    nd.is_centroid = 0
    nd.save()
We set the graph for computation
graph.set_graph('distance')
graph.set_skimming('distance')

# Get the nodes that are part of the car network
missing_nodes = [x[0] for x in
                 project.conn.execute(f"Select node_id from nodes where instr(modes, '{mode}')").fetchall()]
missing_nodes = np.array(missing_nodes)

# And prepare the path computation structure
res = PathResults()
res.prepare(graph)
Now we can compute all the path islands we have
islands = []
idx_islands = 0
#
while missing_nodes.shape[0] >= 2:
    print(datetime.now().strftime("%H:%M:%S"), f' - Computing island: {idx_islands}')
    res.reset()
    res.compute_path(missing_nodes[0], missing_nodes[1])
    res.predecessors[graph.nodes_to_indices[missing_nodes[0]]] = 0
    connected = graph.all_nodes[np.where(res.predecessors >= 0)]
    connected = np.intersect1d(missing_nodes, connected)
    missing_nodes = np.setdiff1d(missing_nodes, connected)
    print(f'    Nodes to find: {missing_nodes.shape[0]:,}')
    df = pd.DataFrame({'node_id': connected, 'island': idx_islands})
    islands.append(df)
    idx_islands += 1

print(f'\nWe found {idx_islands} islands')
Out:
06:33:52  - Computing island: 0
    Nodes to find: 2
06:33:52  - Computing island: 1
    Nodes to find: 0

We found 2 islands
consolidate everything into a single DataFrame
islands = pd.concat(islands)

# And save to disk alongside our model
islands.to_csv(join(fldr, 'island_outputs_complete.csv'), index=False)

# If you join the node_id field in the csv file generated above with the a_node or b_node fields
# in the links table, you will have the corresponding links in each disjoint island found
project.close()
Total running time of the script: ( 0 minutes 1.065 seconds)