Note
Go to the end to download the full example code
Editing network geometry: Splitting link#
In this example, we split a link right in the middle, while keeping all fields in the database equal. Distance is proportionally computed automatically in the database.
Imports
from uuid import uuid4
from tempfile import gettempdir
from os.path import join
from aequilibrae.utils.create_example import create_example
from shapely.ops import substring
import matplotlib.pyplot as plt

# We create the example project inside our temp folder
fldr = join(gettempdir(), uuid4().hex)

project = create_example(fldr)
We will split link 37 right in the middle Let’s get the link and check its length
links = project.network.links
all_nodes = project.network.nodes

link = links.get(37)
print(link.distance)
6010.108655014215
The idea is basically to copy a link and allocate the appropriate geometries to split the geometry we use Shapely’s substring
new_link = links.copy_link(37)

first_geometry = substring(link.geometry, 0, 0.5, normalized=True)
second_geometry = substring(link.geometry, 0.5, 1, normalized=True)

link.geometry = first_geometry
new_link.geometry = second_geometry
links.save()
The link objects in memory still don’t have their ID fields updated, so we refresh them
links.refresh()
link = links.get(37)
new_link = links.get(new_link.link_id)
print(link.distance, new_link.distance)
3005.040184141035 3005.0684894898027
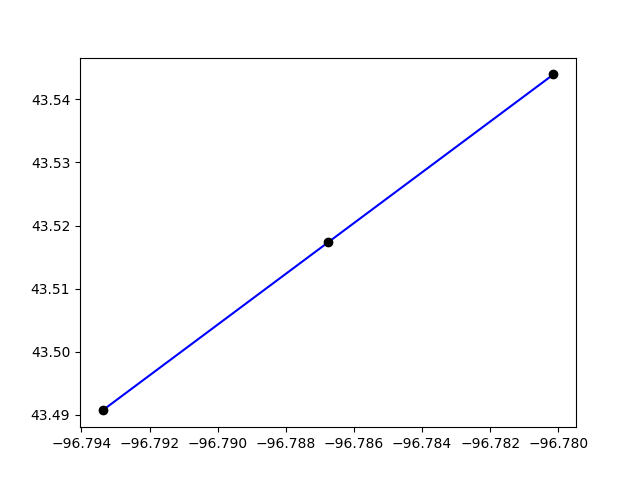
We can plot the two links only
plt.clf()
plt.plot(*link.geometry.xy, color="blue")
plt.plot(*new_link.geometry.xy, color="blue")

for node in [link.a_node, link.b_node, new_link.b_node]:
    geo = all_nodes.get(node).geometry
    plt.plot(*geo.xy, "o", color="black")
plt.show()
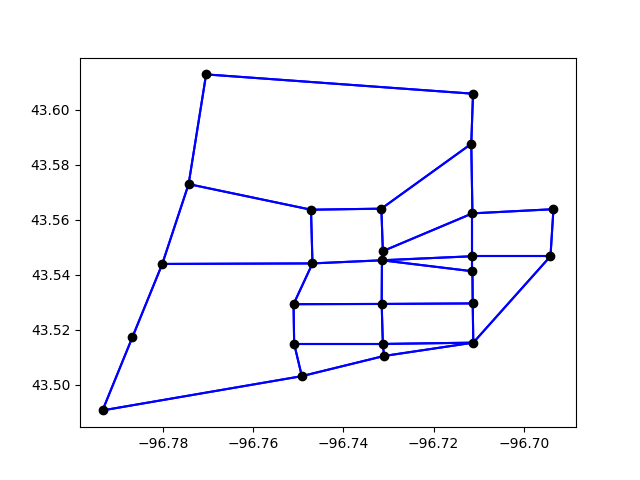
Or we plot the entire network
plt.clf()
curr = project.conn.cursor()
curr.execute("Select link_id from links;")

for lid in curr.fetchall():
    geo = links.get(lid[0]).geometry
    plt.plot(*geo.xy, color="blue")

all_nodes = project.network.nodes
curr = project.conn.cursor()
curr.execute("Select node_id from nodes;")

for nid in curr.fetchall():
    geo = all_nodes.get(nid[0]).geometry
    plt.plot(*geo.xy, "o", color="black")

plt.show()
project.close()
Total running time of the script: (0 minutes 0.724 seconds)