Data#
In the data tab the user can check and load the non-geographic data available in the project.
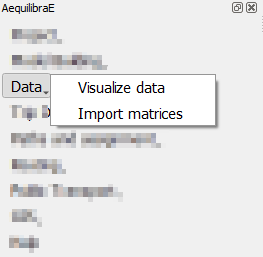
Visualize data#
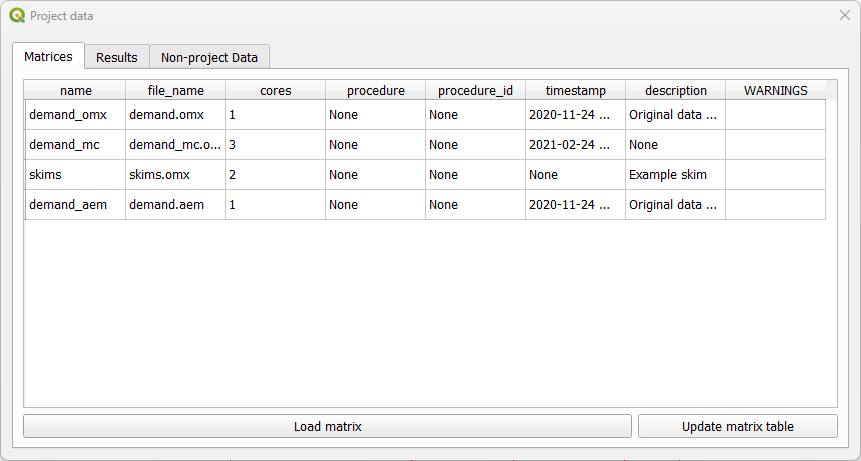
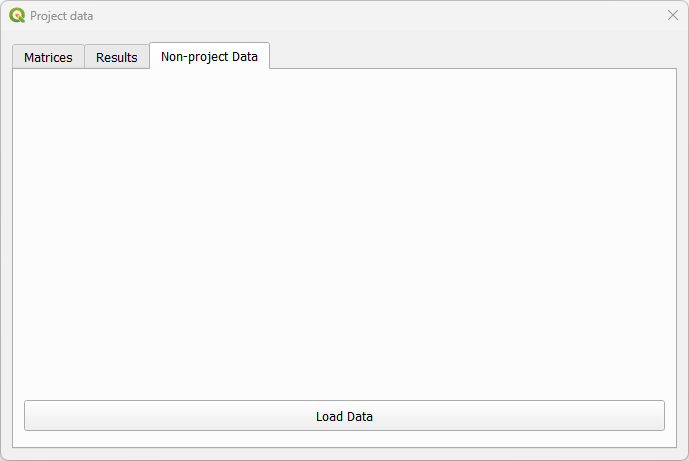
When clicking Data > Visualize data, a new window with three different tabs opens. The tab matrices shows the matrices available for the current project (see figure below).
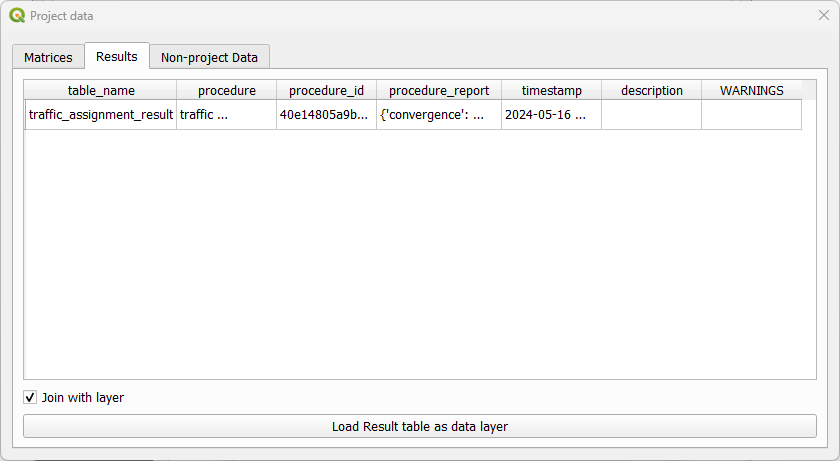
As for the tab results it displays the results of procedures that took place, such as the creation of Delaunay Lines, and that are saved in a results_database.sqlite.
The tab non-project data allows you to open and visualize matrices and datasets in the following extensions: *.omx and *.aem. This is the only tab available if no AequilibraE project is open. Suppose you want to check a skim matrix from a previous project. When clicking the Load data button, you can point AequilibraE the location of the file and its visualization is displayed.
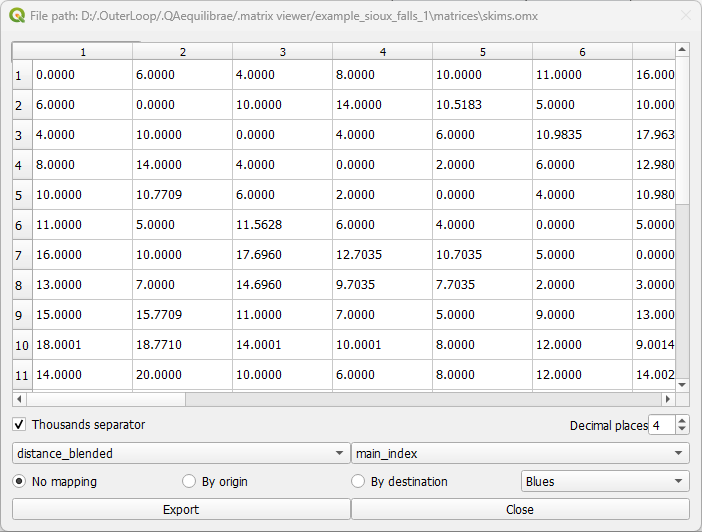
Check the figure below to see how the visualization window looks like! General configurations for data displaying such as the number of decimal places and the usage of thousand separator are available. In case your file has more than one view, you can select the desired view using the dropdown buttons at the bottom of the page. In our figure, they are represented by the dropdowns containing distance_blended and main_index. To save your current matrix into *.csv format, just click in the export button in the lower left corner of the window.
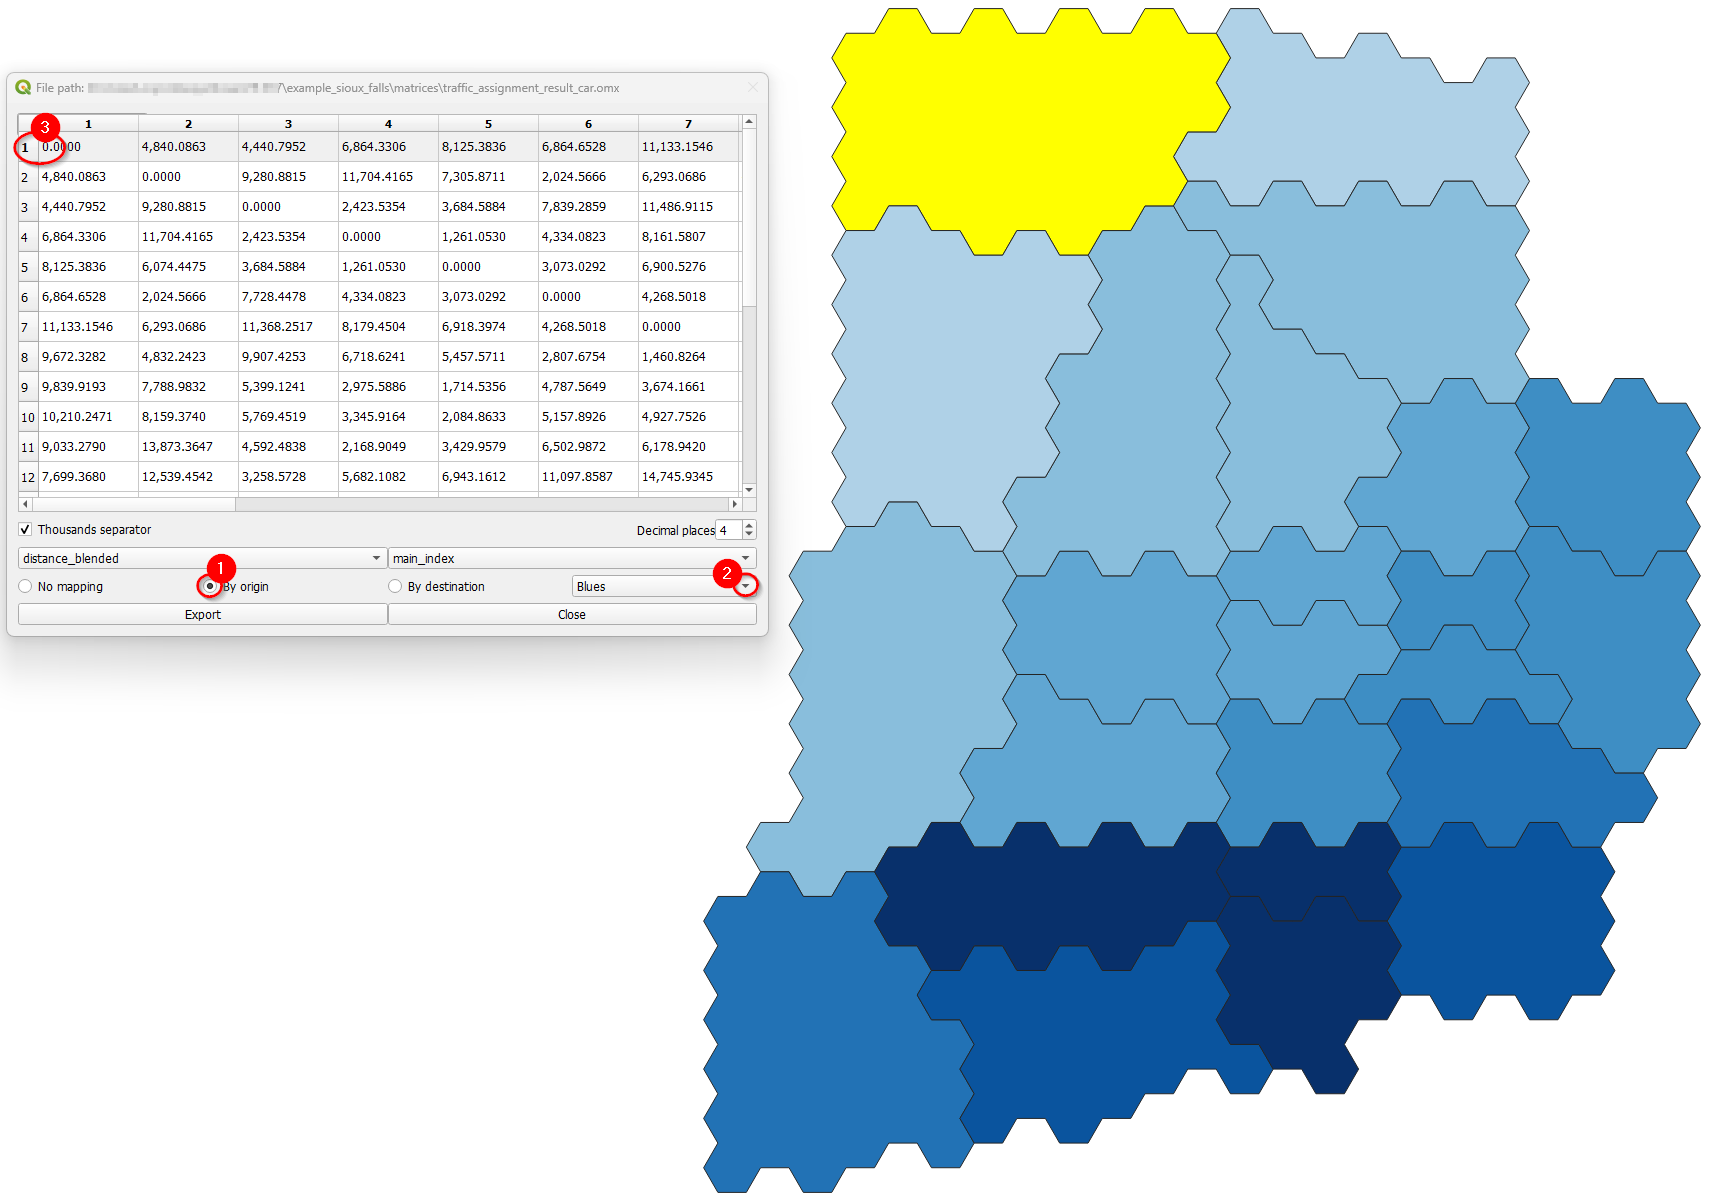
Additionally, we can visualize how the matrices look like in the map! Using the buttons By origin and By destination, it is possible to select the traffic zone by its origin or destination. If one select By origin, then click on the desired row, and notice that is going to be highlighted. The zones layer (if it exists) is going to be loaded and the corresponding zones are going to receive a different color shade, according to the color palette selected in the dropdown menu. One other possibility to select the zone for displaying is directly into the map canvas: with the Select features button enabled, just click on the desired zone in the layer and you’ll notice that the color shades will change accordingly, as well as the row selection in the matrix.
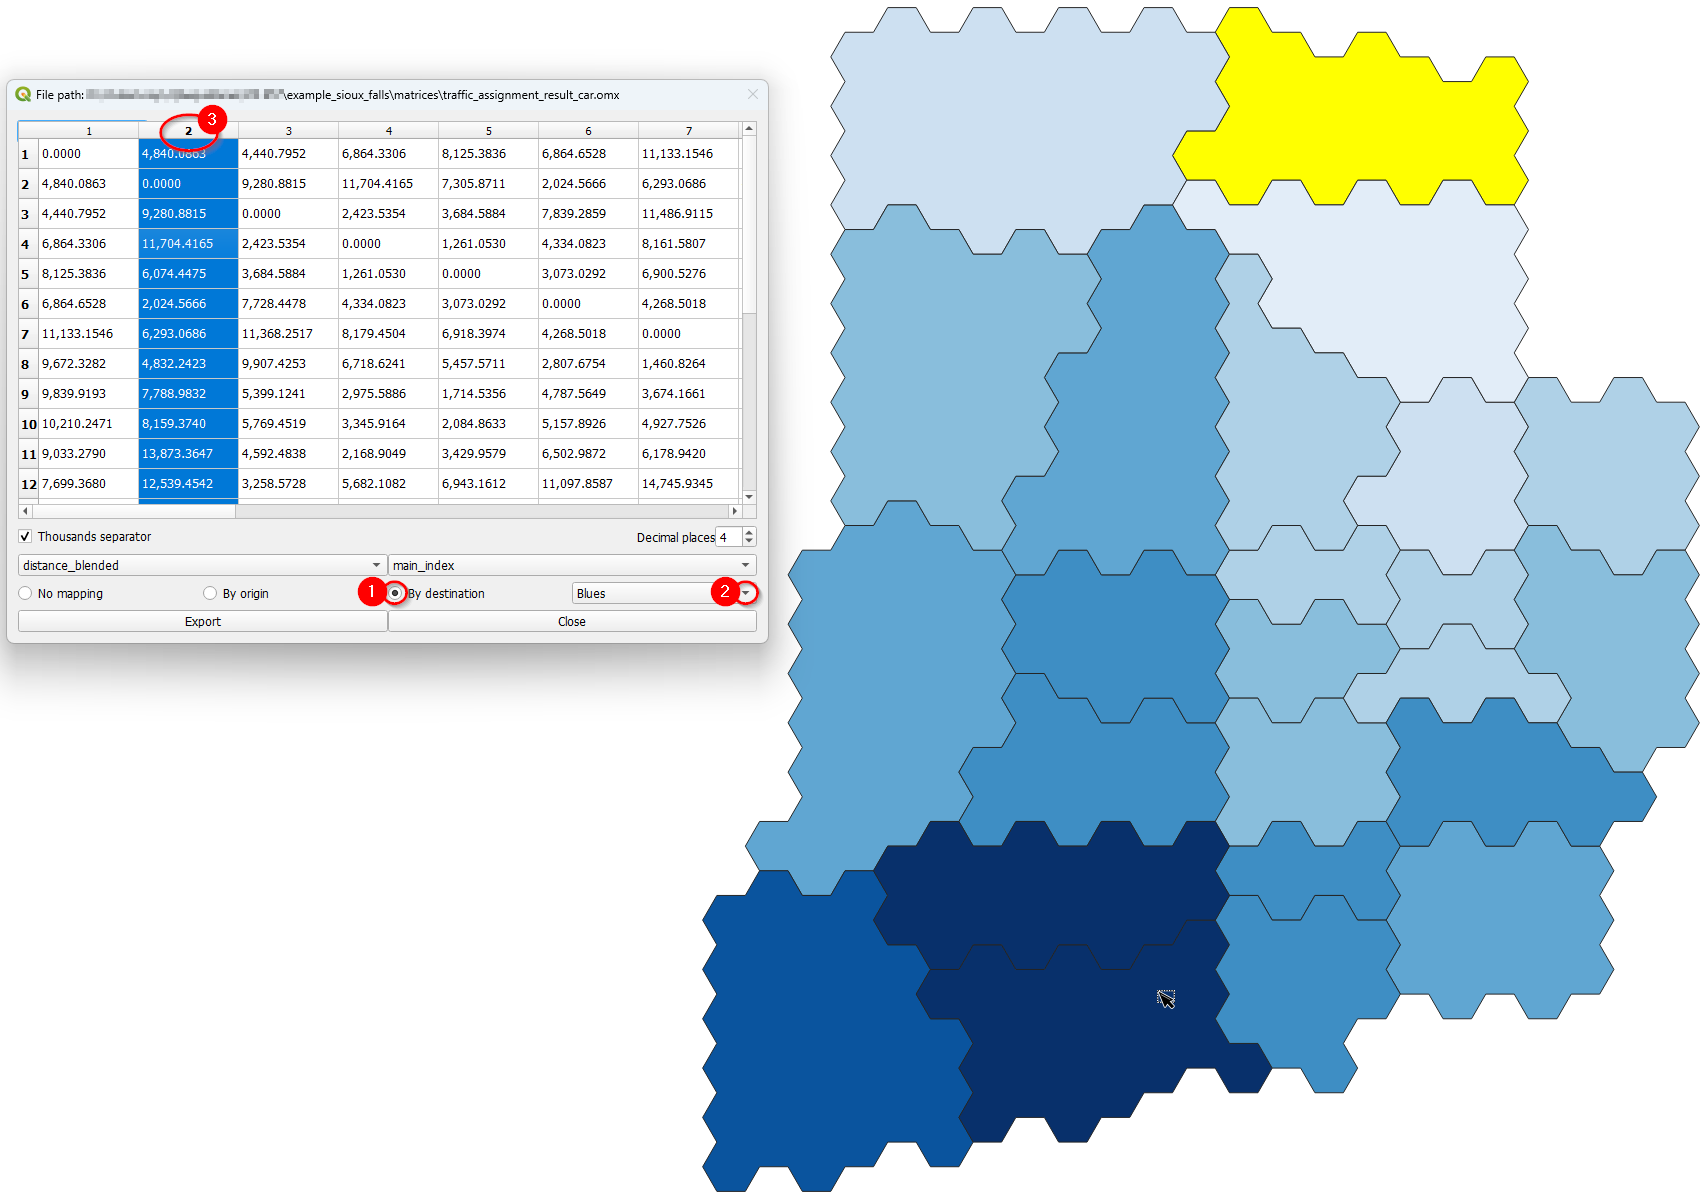
The step-by-step when selecting By destination, is identical to the one before. Select the desired column (destination), notice that it will be highlighted, and the zones layer is going to present a color shade according to the color palette selected. The selection of zones for displaying is also available for destinations, and the steps are the same as presented above.
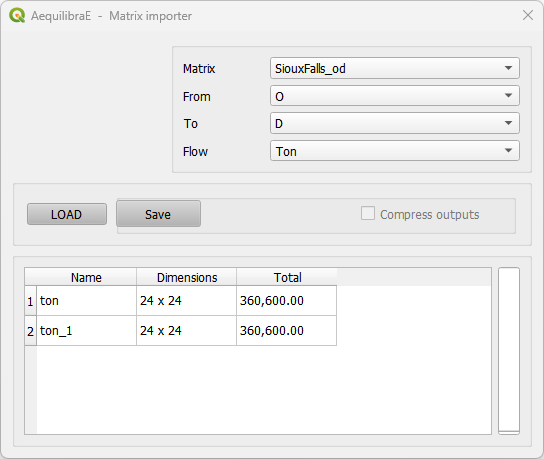
Importing matrices to project#
It is also possible for the user to import matrices from an open layer to a project. This can be done by clicking Data > Import Matrices and properly indicating the fields in the new window. First click Load and then Save. A new window will open and you can point to the project matrices folder. To take a look in the matrix you just imported, you can upload the matrix table and display it as shown in the last topic.