Ctrl+K

AequilibraE 1.1.3

Site Navigation

  • Examples
  • Modeling with AequilibraE
  • API Reference

Site Navigation

  • Examples
  • Modeling with AequilibraE
  • API Reference

Section Navigation

  • Creating Models
    • Create project from OpenStreetMap
    • Create a zone system based on Hex Bins
    • Import GTFS
    • Create project from a link layer
    • Create project from GMNS
  • Editing networks
    • Editing network geometry: Nodes
    • Editing network geometry: Links
    • Editing network geometry: Splitting link
  • Skimming
    • Network skimming
    • Path computation
  • Assignment Workflows
    • Public transport assignment with Optimal Strategies
    • Route Choice set generation
    • Route Choice
    • Forecasting
    • Route Choice with sub-area analysis
  • AequilibraE without a Model
    • Running IPF without an AequilibraE model
    • Traffic Assignment without an AequilibraE Model
  • Visualization
    • Creating Delaunay Lines
    • Exploring the network on a notebook
  • Other Applications
    • Logging to terminal
    • Checking AequilibraE’s log
    • Exporting network to GMNS
    • Finding disconnected links
  • Examples
  • Visualization

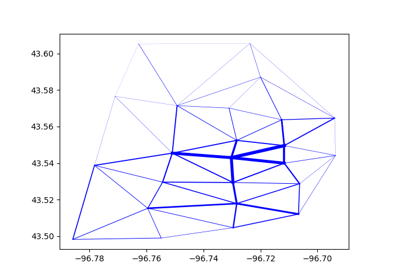
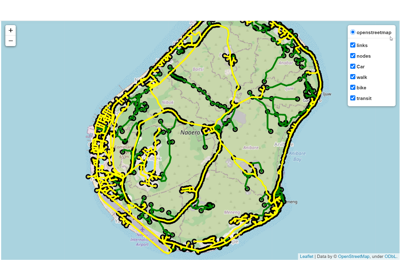
Visualization#

Examples in this session allows the user to plot some data visualization.

Creating Delaunay Lines

Creating Delaunay Lines

Exploring the network on a notebook

Exploring the network on a notebook

previous

Traffic Assignment without an AequilibraE Model

next

Creating Delaunay Lines

Show Source

© Copyright 2024-11-08, AequilibraE developers.

Created using Sphinx 8.1.3.

Built with the PyData Sphinx Theme 0.13.3.