Note
Go to the end to download the full example code.
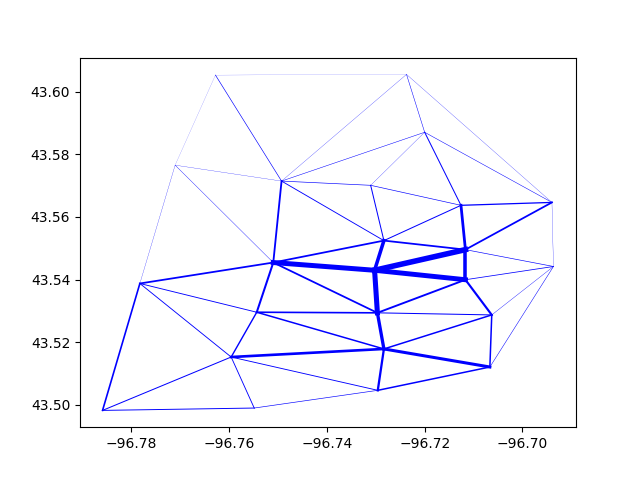
Creating Delaunay Lines#
In this example, we show how to create AequilibraE’s famous Delaunay Lines, but in Python.
For more on this topic, see its first publication.
We use the Sioux Falls example once again.
See also
Several functions, methods, classes and modules are used in this example:
# Imports
import pandas as pd
from uuid import uuid4
from os.path import join
import sqlite3
from tempfile import gettempdir
import matplotlib.pyplot as plt
import shapely.wkb

from aequilibrae.utils.create_example import create_example
from aequilibrae.utils.create_delaunay_network import DelaunayAnalysis
# We create an empty project on an arbitrary folder
fldr = join(gettempdir(), uuid4().hex)

project = create_example(fldr)
Get the Delaunay Lines generation class
da = DelaunayAnalysis(project)

# Let's create the triangulation based on the zones, but we could create based on the network (centroids) too
da.create_network("zones")
Now we get the matrix we want and create the Delaunay Lines
demand = project.matrices.get_matrix("demand_omx")
demand.computational_view(["matrix"])
And we will call it ‘delaunay_test’./ It will also be saved in the results_database.sqlite
da.assign_matrix(demand, "delaunay_test")
delaunay                                          :   0%|          | 0/24 [00:00<?, ?it/s]
Equilibrium Assignment                            :   0%|          | 0/250 [00:00<?, ?it/s]
All-or-Nothing - Traffic Class: delaunay          :   0%|          | 1/250 [00:00<00:00, 39199.10it/s]
All-or-Nothing - Traffic Class: delaunay          :   0%|          | 1/250 [00:00<00:00, 7269.16it/s]
All-or-Nothing - Traffic Class: delaunay          :   0%|          | 0/250 [00:00<?, ?it/s]
All-or-Nothing - Traffic Class: delaunay - Zones: 0/24:   0%|          | 0/250 [00:00<?, ?it/s]
All-or-Nothing - Traffic Class: delaunay - Zones: 10/24:   0%|          | 0/250 [00:00<?, ?it/s]
All-or-Nothing - Traffic Class: delaunay - Zones: 20/24:   0%|          | 0/250 [00:00<?, ?it/s]
All-or-Nothing - Traffic Class: delaunay - Zones: 24/24:   0%|          | 0/250 [00:00<?, ?it/s]
we retrieve the results
conn = sqlite3.connect(join(fldr, "results_database.sqlite"))
results = pd.read_sql("Select * from delaunay_test", conn).set_index("link_id")
Now we get the matrix we want and create the Delaunay Lines
links = pd.read_sql("Select link_id, st_asBinary(geometry) geometry from delaunay_network", project.conn)
links.geometry = links.geometry.apply(shapely.wkb.loads)
links.set_index("link_id", inplace=True)

df = links.join(results)

max_vol = df.matrix_tot.max()

for idx, lnk in df.iterrows():
    geo = lnk.geometry
    plt.plot(*geo.xy, color="blue", linewidth=4 * lnk.matrix_tot / max_vol)
plt.show()
Close the project
project.close()
Total running time of the script: (0 minutes 0.471 seconds)